Recently, I had the chance use Google Analytics for a couple UX projects here at Mitsue-Links. Google Analytics allows anyone to view a vast amount of data concerning site usage and user behavior. The bounce rate is one of the most basic pieces of data available. Many of you will probably be familiar with what a bounce rate is, but just in case, a bounce occurs when a user visits a site and leaves without clicking through to another page within the site. Therefore the bounce rate is the proportion of users that have bounced off your site.
 User A has clicked through to www.example.com/products after landing on the homepage, and therefore did not bounce. User B, on the other hand, has left after only having visited www.example.com, and will be considered to be a bounced user.
On paper, a high bounce rate seems bad. It could indicate that the majority of users are leaving the site without any engagement whatsoever. It could mean that users found the site too difficult to use, or perhaps they found the contents of the site to be useless. A quick search will bring up plenty of blog posts detailing the negative effects of high bounce rates, and what you can do about it. However, most of these sites fail to mention that a high bounce rate isn't necessarily an indicator that the site is performing poorly.
Your Bounce Rate (Maybe) Isn't That Bad at All
Just because a user bounced does not mean that the user had no positive engagement with the site. For example, bounces can also occur if the user finds the exact piece of information they were looking for on the first page that they landed on. If the user's intention were to find the phone number they could call for support, and they landed on the contacts page where the phone number was immediately available, they would have no reason to click through to other pages within the site. Having completed their objective, the user will leave the site satisfied, and with no need to click through to any other page within the site. This kind of bounce could occur at a variety of page types, such as product pages or blog posts.
Here's the thing. The bounce rate (be it high or low), on its own, is neither good nor bad. It's just a number. The bounce rate needs to be considered along with more contextual information, such as the page the bounces are occurring at or how the users are arriving at that page, before a conclusion should be reached on whether it is a problem or not.
So, how exactly would you differentiate between good bounces and bad bounces?
Figuring Out Where and Why the Bounces Are Occurring
The first step should be to check where the bounces are occurring, and to find any potential reasons that the bounces may be happening there. The overall site wide bounce rate can be useful monitoring bounce rates over long periods of time, but its scope is too large to pinpoint where exactly the bounces are occurring.
The All Pages report in Google Analytics is a good place to start looking for where bounces are occurring. However, you shouldn't simply sort the list of pages on the site by bounce rate. You'll likely find that the pages that come to the top of the list will have very few views, and bounce rates of 100% or 0%, depending on the sort direction. Instead, use the weighted sort feature. Google Analytics' weighted sort feature allows you to sort the bounce rate (and other metrics) depending on how impactful it is for your site's performance. This list will give you a better overview of where the bounces are occurring (or not occurring) within your site.
Once you have a rough idea of the pages that might have extreme bounce rates, the next step is to figure out how the users are coming to that page. Are they searching for a keyword, or being referred to from a certain site? The context under which the user was visiting the page may indicate the intention they had upon landing on your site, and this can help you decide whether the bounces (or lack thereof) are beneficial or harmful. For example, suppose you have a fashion e-commerce site that has a product details page for a jacket with a very high bounce rate. If many users are coming to the page via search engine results to see what colors are available for the jacket and this information is easily accessible to the user, they may be bouncing off the site satisfied after finding the information they were looking for. On the other hand, if the bounces are occurring because the users were coming to the site looking for shirts, this could mean that there are SEO issues with the page leading to the bounces.
Digging Even Deeper into the Bounce Rate
Now, you might have a rough idea of what users were doing before they came to the site. You can also learn more about how users may have behaved upon landing on the page by using Google Analytics' custom events which can be implemented using JavaScript code within your site's code or by using Google Tag Manager.
One metric that becomes available using custom events is scroll depth, which allows you to see if your users actually scrolled through your page or not. However, be careful not to take a high scroll rate to mean that users are reading and interacting with your page. It may simply mean that the user was just quickly scanning through the page before deciding that they were not interested. This can be mitigated by measuring the user's time on page along with the scroll depth.
The amount of time the user spent on a certain page can be a good indicator of whether users were interacting with the contents or not. For example, a long duration may indicate that many users were reading your blog post, and a short duration may indicate that users only looked at the page for a short amount of time, and determined that the contents were not worth looking into. Whether spending a long time is preferable (i.e. your blog post is being read) or not (i.e. users were getting lost on your FAQ page) will depend on the contents and purpose of the page.
The average time on page metric is available within Google Analytics by default. However, the way Google Analytics measures time on page is not ideal. Google Analytics measures this metric by calculating the time difference between when the user lands on the page, and when they clicked through to a different page within the site. Since bounced users have not actually clicked through to a different page within the site, it is impossible for Google Analytics to calculate how long they spent on that page. For these bounced users, time on page is recorded as 0 seconds, even if they had actually spent several minutes on the page. Since this 0 second value is taken into account when calculating the average time on page for all users, this means that the actual amount of time users spent on the page can be much different from what is shown to be the average time on page on Google Analytics. For example, suppose both users A and B, from the image at the beginning both spent 10 minutes on the homepage. For user A, the 10 minutes spent on the page is recorded when he clicks through to the next page. For user B however, the time on page is never recorded because the user bounced and never clicked through to a second page within the site. Instead, the user's time on page is considered to be 0 seconds. Therefore, the average time on page for all users is displayed as 5 minutes on Google Analytics, even though in reality, the average amount of time users had stayed on the page was 10 minutes.
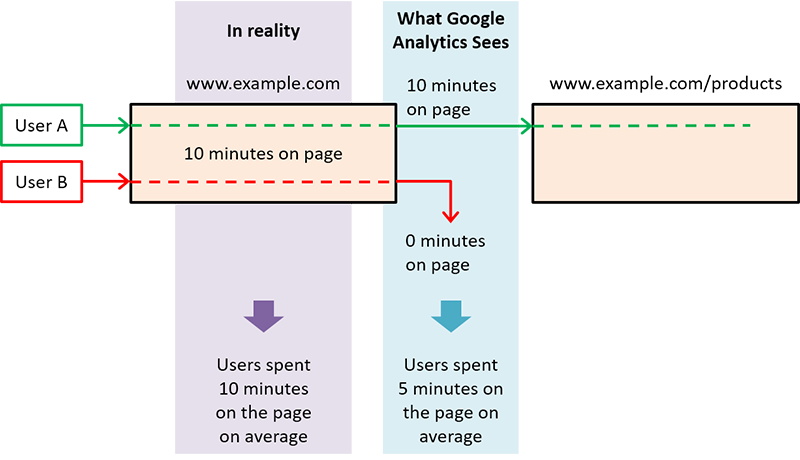 Even though both User A and User B have spent 10 minutes on the page, Google Analytics records bounced users as having spent 0 minutes on the page. This can skew the average time on page metric.
In other words, Google Analytics, by default, unfortunately cannot provide insights about how long bounced users stayed on the landing page before they left, even if that user had spent the last 10 minutes looking at the contents on the page. Fortunately, by setting custom event tags (using JavaScript or Google Tag Manager, as mentioned) that send data to Google Analytics once the user has stayed on the same page for a set amount of time, you can get a rough idea of how much time users spent on the page.
Looking at scroll depth in conjunction with time spent on page, should give you a clearer view into how users were behaving on the page before they bounced.
In Conclusion
As mentioned, the bounce rate is just a number which should neither be considered to be good or bad. Look at which pages the bounce rates were occurring, how users were landing on that page, and how they were behaving once they landed. I've come to realize that looking at data from Google Analytics on the surface level can give us an overview of how the site is doing, but there is a lot more information available when you dig deeper which can help diagnose where and what things are actually occurring on the site. The key is to keep digging deeper in order to figure out how and why your bounce rate is at that value. Don't be worried if you think your bounce rate may be too high. You might find a very good reason for it!