For some, marketing and user experience couldn't feel farther apart. But as many organizations have realized, these fields occupy similar space and should be utilized in tandem. For example, broad market trends can not only inform the design process but also increase the efficacy of user research. However, accessing this information can often be difficult for international companies based outside of their target markets. In this post, we will share some recent insights on online shopping via government and opinion surveys currently only available in Japanese.
General Data
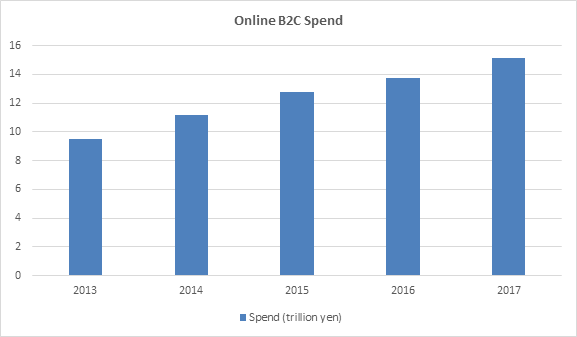 Figure 1. Source: adapted from 平成28年度: 我が国におけるデータ駆動型社会に係る基盤整備(電子商取引に関する市場調査): p.26 : released April 2017.
According to a report published earlier this year by Japan's Ministry of Economy, Trade and Industry, total B2C e-commerce spend in 2016 approached ¥15.2 trillion (figure 1), a year over year increase of almost 10%. Furthermore, online spending exceeded 5% of total annual consumption expenditure for the first time.
Breaking this spend down by the Japanese online population of just over 100 million, or 83% of the total, gives an annual per capita spend of ¥150,000 (around US$1,340). According to the same data, home computer ownership was at 57%, tablet ownership was at 18% and smartphone penetration was at 54% in 2016. The low level of smartphone penetration has its roots in a slow start for smartphones in Japan. It's also in part due to the long-standing popularity of the feature phone. However, the rate of smartphone usage has been steadily climbing.
Spending Patterns
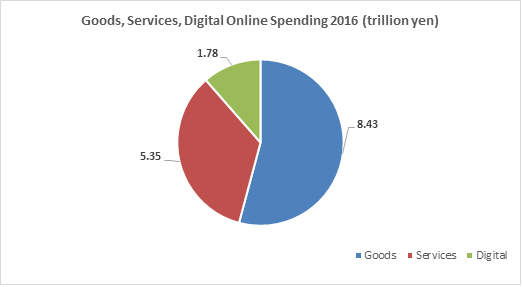 Figure 2. Source: adapted from 平成28年度: 我が国におけるデータ駆動型社会に係る基盤整備(電子商取引に関する市場調査): p.25 : released April 2017.
The Japanese government breaks total amount of online spending into three categories - goods, services and digital. Between 2015 and 2016, each recorded respective growth of 10.6%, 9.2% and 8.9%. These broad categories were then separated into subcategories, which we'll take a look at next.
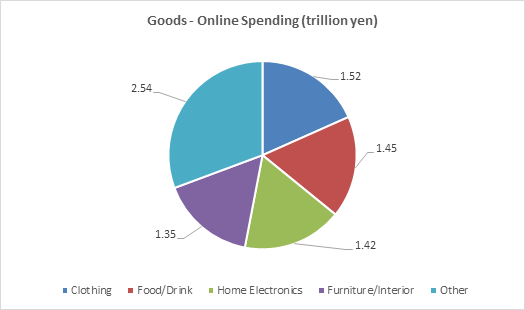 Figure 3. Source: adapted from 平成28年度: 我が国におけるデータ駆動型社会に係る基盤整備(電子商取引に関する市場調査): p34. : released April 2017.
The top four sub-categories amounted to a sizable 68% of spending (figure 3). Although, as percentages of their respective total spend markets, there were significant contrasts. For example, almost 30% of total home electronics spending took place online, whereas online spending on food and beverage was only slightly over 2%. As local ventures such as IY Fresh, which launched earlier this week, and international giants like Amazon move into the food delivery space, rapid growth is anticipated.
This data also highlights an increasing shift to making purchases via smartphone. Last year mobile spending on goods recorded a new high of ¥2.55 trillion, or 32% of online spend. For comparison, in 2015 smartphone spending amounted to ¥1.98 trillion or 27% of total online spend. As this shift continues, it becomes increasingly important to ensure mobile site/app usability is first-rate, and many Japanese companies are adopting the mobile-first approach.
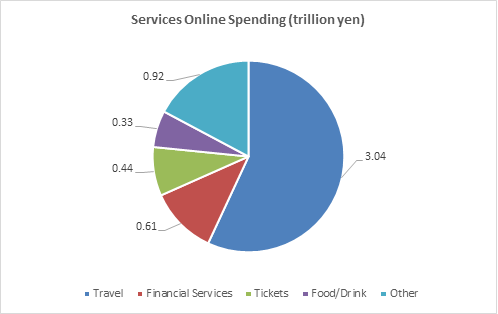 Figure 4. Source: adapted from 平成28年度: 我が国におけるデータ駆動型社会に係る基盤整備(電子商取引に関する市場調査): p.42 : released April 2017.
As for online spending on services, travel was the clear leader. However, the fastest year-on-year growth in this category was the eating/drinking/. Despite registering only 6% of total service spend at ¥0.33 trillion, it was up 38% compared to 2015. This is perhaps due to an increasing array of delivery service options, such as Uber Eats, Maishoku, Demae-can, and Rakuten delivery.
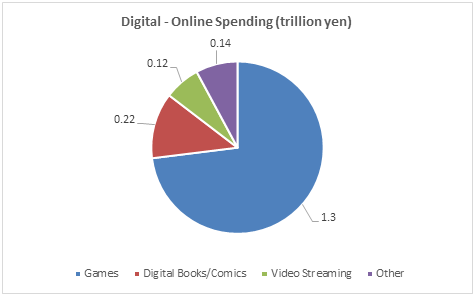 Figure 5. Source: adapted from 平成28年度: 我が国におけるデータ駆動型社会に係る基盤整備(電子商取引に関する市場調査): p46:: released April 2017.
Finally, games topped online digital spending at ¥1.30 trillion (Figure 5). Much of this likely the result of how well Japanese companies have utilized microtransactions. It also helps that Japanese, when compared to Americans, spend far more time in game, thereby increasing the chance for monetization.
For the other sub-categories, paid video streaming recorded the highest year-on-year growth up 77% from 2015, when both Netflix and Amazon Prime Video entered the market, while digital book/comic consumption also recorded high year-on-year growth of 20%.
Opinions
Now that we've painted a picture of the e-commerce market by the numbers, we'll share some Japanese consumer opinions regarding online shopping from a May 2017 investigation by Nifty that surveyed 2,686 respondents. The survey revealed that 53.5% of respondents admit to shopping online at least once a month. It also detailed responses to questions such as what's most important when, the appeal of, and the negatives of shopping online.
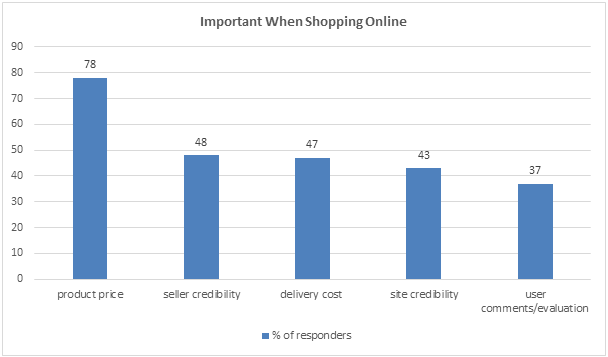 Figure 6. Source: adapted from ネットショッピングについてのアンケート・ランキング: Report 6 : released May 2017.
Product price proved to be the most important factor of online shopping (figure 6). These responses highlight the need for both content and site localization. As Japanese consumers have a penchant for risk avoidance, companies entering the market may need to adopt a more bespoke approach, as opposed to other markets, in order to ensure websites and apps deliver credibility. Good practice, such as the inclusion of contact information, provision of additional product/service information, and using appropriate localization/native translation, can go a long way toward providing peace-of-mind and driving conversions.
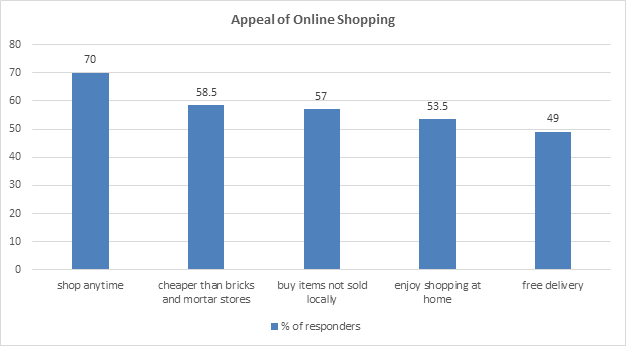 Figure 7. Source: adapted from ネットショッピングについてのアンケート・ランキング: Report 4 : released May 2017.
Respondents deemed the main advantage of online shopping is that it can be done anytime - this is especially important Japan, a country whose workers notoriously lack free time. Shopping on a lunch breaks, while waiting for trains, or at home ensures the most productive use of time. Other positives among Japanese include cheaper prices and the possibility for consumers to purchase items not sold locally (Figure 7). Another plus for Japanese consumers is the presence of user comments/evaluation - compared to the description provided by the seller, these provide much more insight and reassurance as buyers learn they won't be the first to buy.
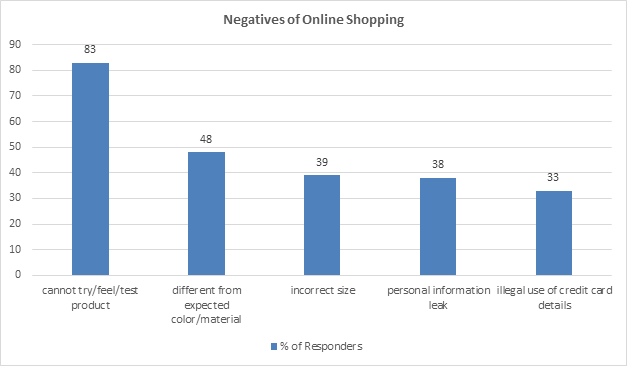 Figure 8. Source: adapted from ネットショッピングについてのアンケート・ランキング: Report 5 : released May 2017.
The most frequent concern about shopping online was that products could not be seen/tested, followed by anxieties over items differing from expected color/material, and sizing issues (Figure 8). These responses again highlight local consumers' risk-off approach to shopping. To provide reassurance, sites should provide as much information as possible and offer customer support/have a returns policy. One way that Japanese currently mitigate the above-mentioned risks is through showrooming: they go to a bricks and mortar store, test/try out the product, then buy online. However, in the future they may use services such as e-commerce giant Rakuten's FitsMe app and online mall Zozotown's recently announced Zozosuit which uses sensor technology to capture 15,000 body measurements. Also of concern were the leaks of personal information, as well as illegal use of credit card data. For e-commerce sites, seller commitment to security should be clearly signposted as it can make-or-break a sale.
Key Takeaways
This brief overview of the Japanese market allows insights into what is happening in Japan, in summary:
- The B2C market is growing around 10% a year across goods, services and digital.
- Japanese net users spend an average of ¥150,000 a year, over 50% of those surveyed shop online at least once a month.
- With the shift to smartphones, mobile purchases are increasing. Therefore, ensure sites provide positive mobile experiences.
- Travel takes up the largest total online spending, followed by clothing and home electronics.
- Competitive pricing and free delivery are important but proper localization highlights commitment to security and provides reassurance to a risk adverse market.